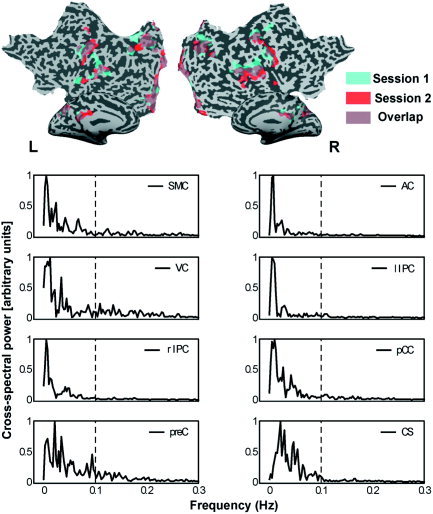
Figure 4.

Upper panel: Spatiotemporal replication of COI functional connectivity maps of session 1 (blue) and 2 (red) of Subject 1. Overlapping regions are depicted in purple. For reference of the anatomical‐functional clusters, see Figures 1 and 2. Lower panel: Cross‐spectral densities for replicated COIs of Subject 1 are given for each of the paired COIs (normalized for maximum value). A high spectral density indicates high power for that frequency in both COI time courses.
