
Figure 5.
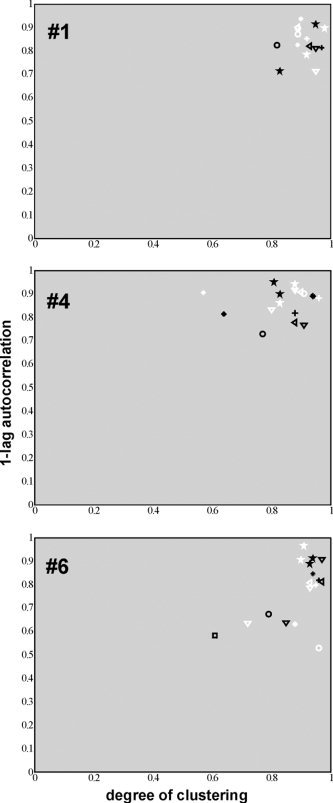
Scatter of the COIs of the first (white) and second (black) sessions according to a spatial (degree of clustering) and a temporal (absolute values of the one‐lag autocorrelation coefficient) measure. From top to bottom the plots are of Subject 1, 4, and 6. Asterisk, AC; plus sign, PVC; open circle, SMC; open square, CS; up triangle, preC; down triangle, pCC; left triangle, SPC; star, IPC/DLPFC.