
Figure 5.
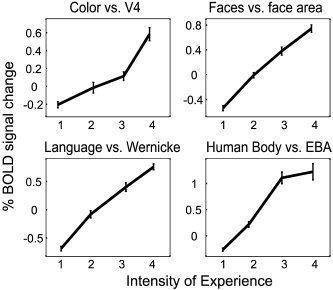
Linear correlation between the intensity of subjective experience of a given feature with the activity in the areas specialized for it. The perceived feature‐intensities (as rated on a scale from 1–4) for color, faces, language and human bodies are plotted against the BOLD signal taken from V4, the face‐selective region in the ST cortex, Wernicke's area, and EBA from all subjects. Corresponding graphs for V4α and FFA were virtually identical and omitted for graphical simplicity. Error bars = SEM.