
Figure 7.
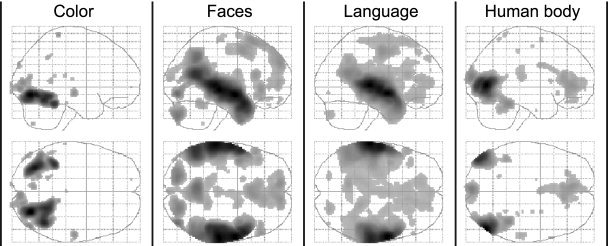
Spatial specificity of feature‐specific activation. Results from four different analyses, using only one of the four feature regressors in each to maximize their power and shown at a low threshold of P < 0.001 uncorrected to illustrate that activity is contained to the functionally specialized regions identified in the original analysis shown in Figure 1.