
Figure 1.
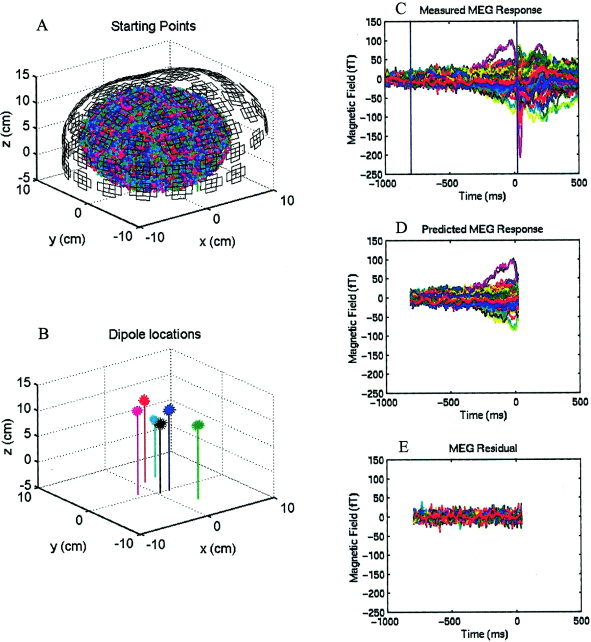
MSST analysis of the MEG recording during a right finger‐lifting response from Subject 1. A: In a six‐dipole fit, 3,000 sets of starting locations were selected randomly within a search volume. The MEG pick‐up coils are also shown. Each set contains six starting dipole locations indicated by six different colors. B: The 15 best‐fitting six‐dipole MSST solutions (indicated by asterisks) with similar reduced‐χ2 values form six clusters in space (x, anterior [+] posterior [−] coordinate; y, left [+] right (−) coordinate; z, superior [+] inferior [−] coordinate). Each vertical line represents the centroid of averaged dipole location for the cluster. C: Measured magnetic field waveforms from 122 MEG channels are superimposed. D: Predicted magnetic fields based on the dipole locations modeled in B. E: Residual magnetic fields, namely the difference between C and D.