
Figure 2.
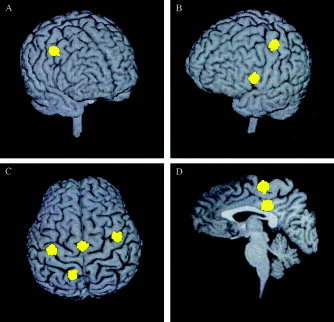
Six dipolar sources (yellow clusters) from Subject 1's right index finger‐lifting MEG response, localized using MSST, and superimposed on the subject's MRI. Three hundred Monte‐Carlo analyses were carried out to obtain the uncertainty of the dipole locations, defined as two standard deviations from the mean of the clustered locations. A: View from front‐right, the right (ipsilateral) hemisphere premotor area (PMA) source. B: View from front‐left, the left (contralateral) hemispheric primary motor area (M1) source and the left prefrontal source. C: View from top, the left M1 and right PMA sources, supplementary motor area (SMA), and left superior parietal source. D: Sagittal view through the interhemispheric fissure, SMA, and posterior cingulate sources.