
Figure 3.
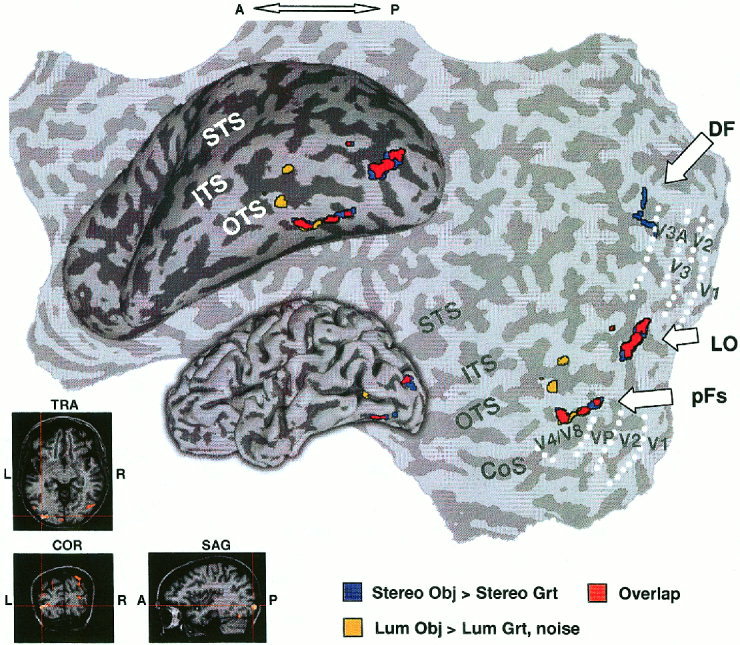
Comparison of object‐selective activation by stereo and luminance cues. Activation foci produced by stereo and luminance cues superimposed on folded, inflated, and unfolded left hemisphere of same subject. Sulci (dark gray), gyri (light gray). LO, lateral occipital; pFs, posterior fusiform; DF, dorsal foci; yellow, “luminance” objects‐selective voxels; blue, “stereo” objects‐selective voxels; red, overlap between them. Borders of retinotopic areas are indicated by white‐dotted lines. LO activation focus also shown on conventional anatomical images (lower left). Note the substantial overlap between stereo‐ and luminance‐defined object selective regions (red) in LOC (LO and pFs). STS, superior‐temporal sulcus; ITS, inferior‐temporal sulcus; OTS, occipito‐temporal sulcus; Cos, collateral sulcus. Note that only the posterior part of the brain was scanned.