
Figure 1.
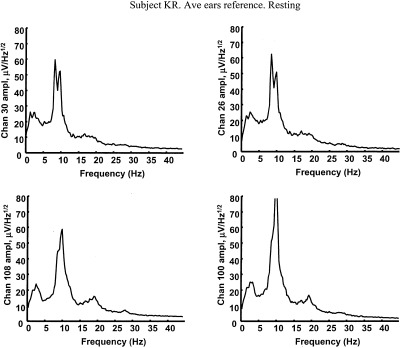
Amplitude spectra based on 5 min of resting EEG (0.2 Hz resolution) with eyes closed, referenced to the (symmetric) digitally averaged potential of the ears. The subject KR is a 38‐year‐old female engineering graduate student. The four locations correspond to left and right frontal and left and right posterior scalp (nose up), roughly sites F3, F4, P3, and P4.