
Figure 9.
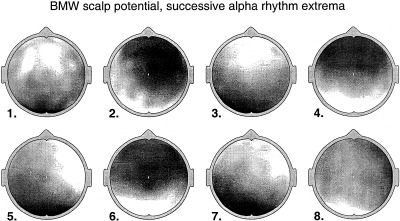
Amplitude distributions of (average reference) resting alpha rhythm at 8 successive times separated by about 50 ms are shown. The times correspond to alternating positive and negative peaks in the potential recorded by posterior‐midline electrode 130. Each plot was constructed by averaging over five adjacent time slices with 2 ms separation between adjacent slices. Amplitudes were normalized with respect to the maximum positive and negative potentials (yellow and blue, respectively). Subject BMW.