Figure 1.

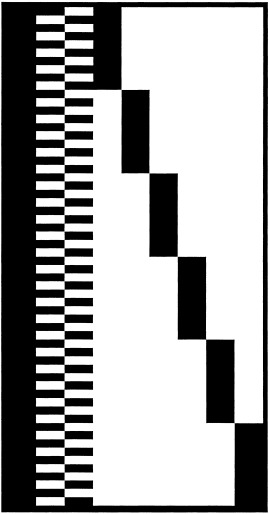
This figure shows the design matrix used. The columns refer to mean value (one column), task factor (two columns) and subject factor (six columns). The rows represents the scans.

This figure shows the design matrix used. The columns refer to mean value (one column), task factor (two columns) and subject factor (six columns). The rows represents the scans.