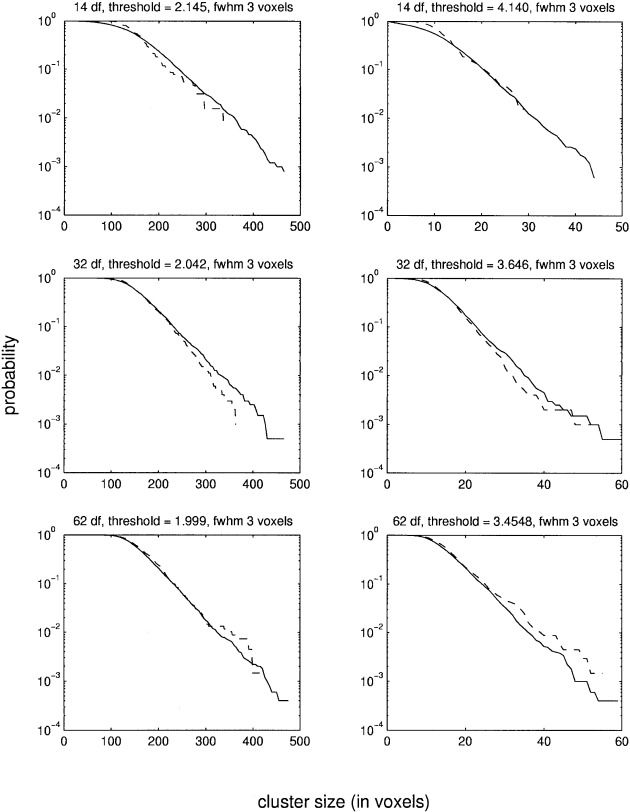
Figure 3.

This figure shows the estimated probabilities of the cluster size statistic. The data are from the synthetical images filtered with a Gaussian filter of three voxels FWHM. Two different thresholds were used for each df. The dashed line shows the reference distribution as determined by randomizations. The solid line shows the probabilities estimated with MCS method. Please note that a logarithmic scale is used for the y‐axis.
