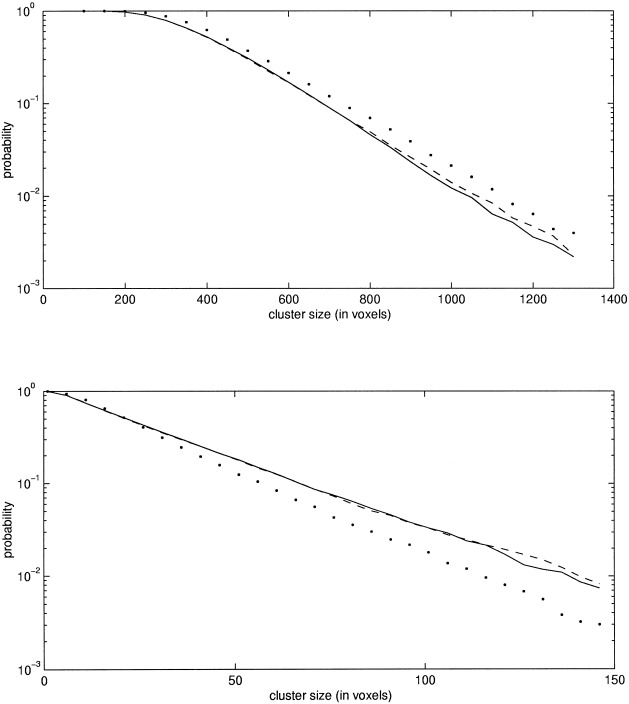
Figure 6.

This figure shows the estimated probabilities of the cluster size statistic for the nonstationary dataset. In the upper figure, the threshold used was 2.0, and in the lower it was 3.457 and 3.454 for the MCS and randomization methods, respectively. The solid, dashed, and dotted lines refer to the MCS, randomization, and CS method, respectively.
