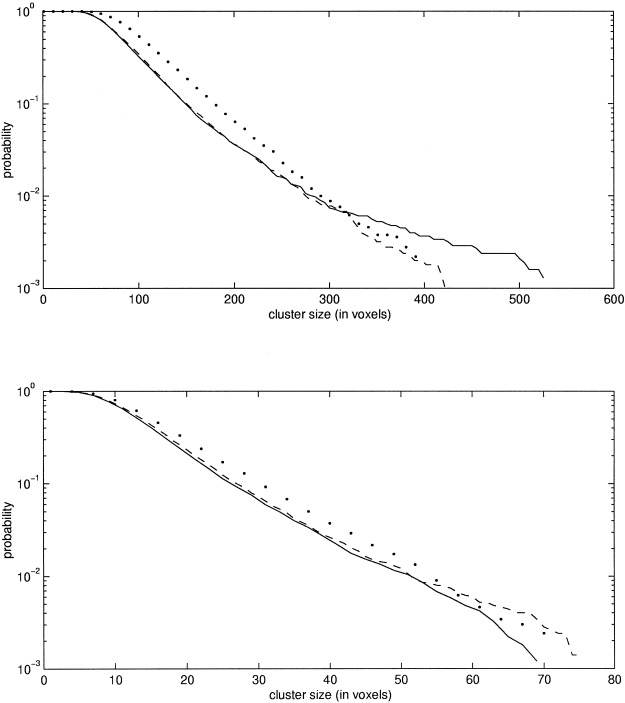
Figure 7.

This figure shows the estimated probabilities of the cluster size statistic for the real PET dataset. The thresholds in the upper figure are 2.399, 2.400, and 2.33 for the randomization, MCS, and CS methods, respectively, and in the lower figure 3.484, 3.488, and 3.29. The dashed line corresponds to the reference distribution as determined with the randomization procedure (step three). The solid line shows the results of the MCS method and the dotted line shows the estimate obtained by the CS method. Please note that a logarithmic scale is used for the y‐axis.
