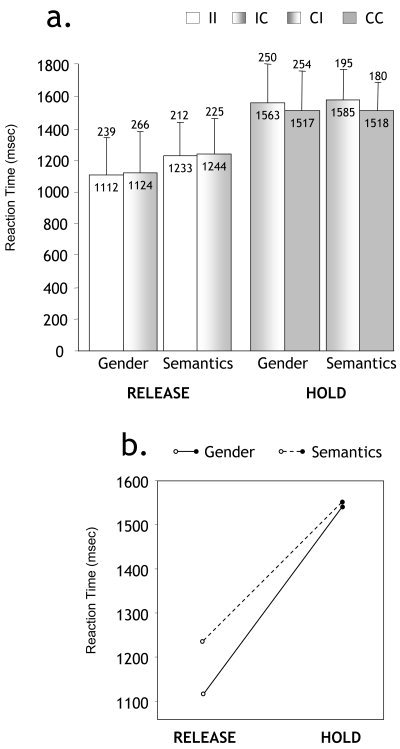
Figure 1.

a:Mean Reaction Times (RTs) in all conditions. Sub‐types corresponding to different stimulus combinations in pairs are distinguished (I refers to Incongruent and C to Congruent regarding the target category). Numeric values of mean and standard deviations are displayed within and above each bar, respectively. b: Plot of the Task * Condition interaction [F(1,23) = 30.6, P < 0.0001].
