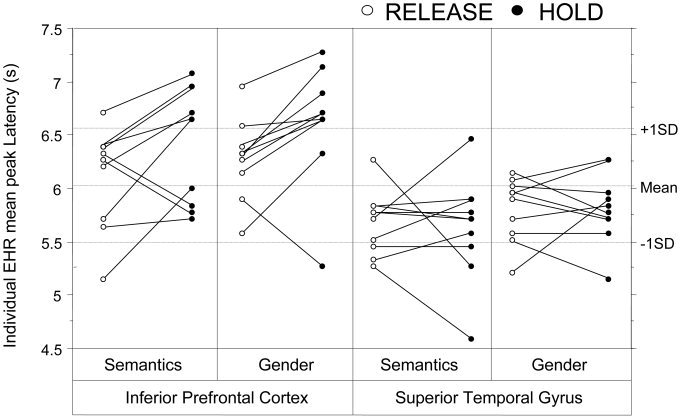
Figure 3.

Individual EHR peak latency plot for the IPC and the STG in both tasks and conditions. Individual EHRs were averaged in search volumes defined by coordinate intervals within Talairach space (see Subjects and Methods ). Voxels included in the EHR analysis were activated at a threshold of P < 0.01 uncorrected. The line drawn between HOLD and RELEASE average EHR peak latencies shows the evolution from one condition to the other in each subject.
