
Figure 2.
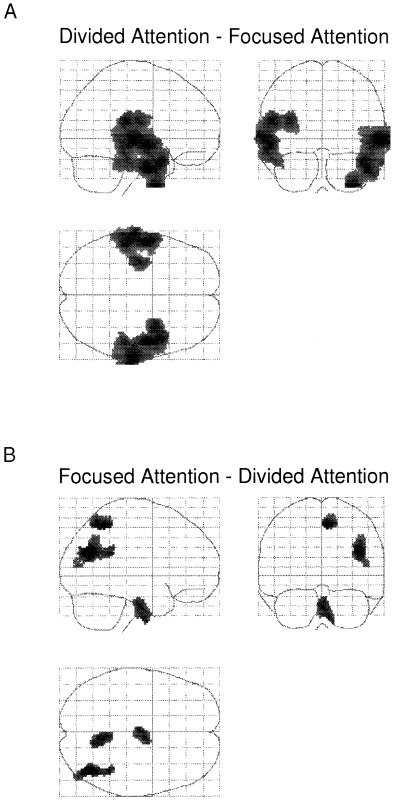
A: Regions activated during the divided attention minus the combined focused attention conditions. B: The lower panel show the reversed subtraction, i.e. the focused attention conditions minus the divided attention condition. The data were transformed to Z‐scores in the SPM‐96 analysis software and projected through sagittal, coronal, and axial views of a transparent brain. The SPM{Z}'s in Figures 2 to 4 are thresholded at p < 0.01, uncorrected, and at a cluster extend threshold of k > 250.