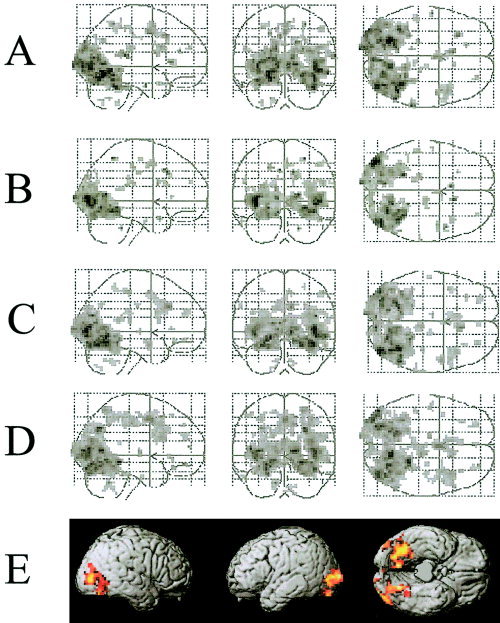
Figure 2.

A–D: Maximum intensity projections illustrating regions that showed signal increases for the New–New condition relative to the Same (A), Rearranged (B), Old–New (C), and New–Old (D) conditions. E: Voxels exhibiting a common difference for the New–New versus all other conditions, identified by an inclusive masking procedure (see text). Activations are rendered onto the cortical surface of the Montreal Neurological Institute normalized canonical brain (Cocosco et al., 1997). All figures thresholded at P < 0.001.
