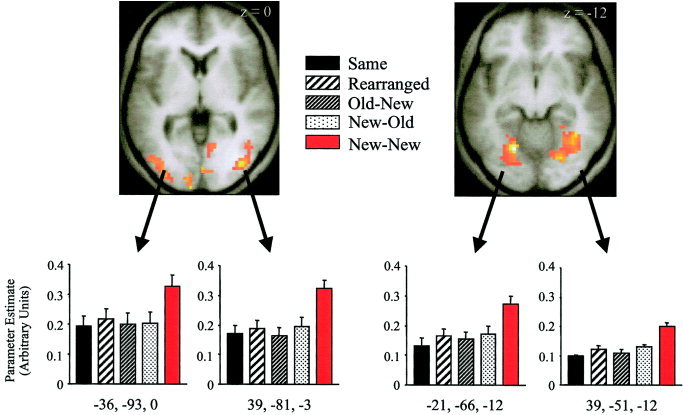
Figure 3.

Parameter estimates on the early covariate from representative voxels in left and right lateral occipital (left) and left and right fusiform (right) regions for each of the five experimental conditions. Activations are rendered onto the normalized T1 anatomical images averaged across subjects. Coordinates are given below each bar graph. Error bars represent SEM.
