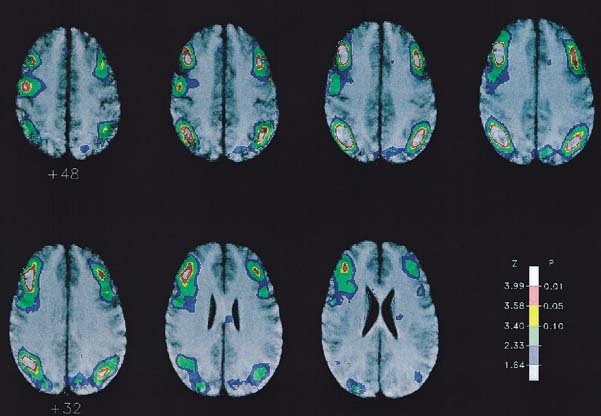
Figure 1.

Cerebral activations determined for the variable target condition compared to the fixed target condition superimposed onto the average MR image of the subject group. Axial slices at 4 mm intervals and parallel with the AC‐PC plane are depicted from z = +48 mm to z = +24 mm. The color scale depicts the Z‐score range for the SPM image as indicated, with the associated probability limits shown after correction for the multiple nonindependent comparisons throughout the brain volume.
