
Figure 2.
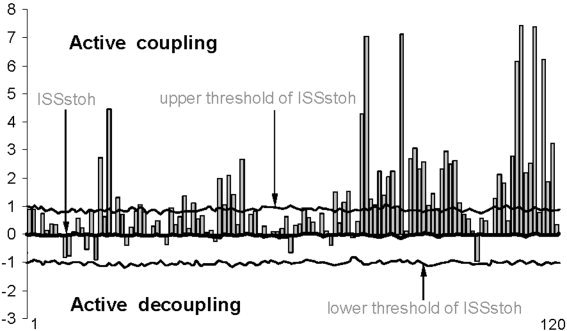
Schematic illustration of index of structural synchrony (ISS) and its stochastic levels. As an example, the calculations of ISS are shown for 16 EEG channels. The y‐axis displays the ISS values found in the experiment (illustrated as gray bars). The x‐axis displays the 120 possible pair combinations of 16 EEG channels (1 = O1–O2, 2 = O1‐–P3, 3 = O1–P4, 4 = O1–T5, … 115 = F4–Fz, 116 = F4–F7, 117 = F4–F8, 118 = Fz–F7, 119 = Fz–F8, 120 = F7–F8).