
Figure 4.
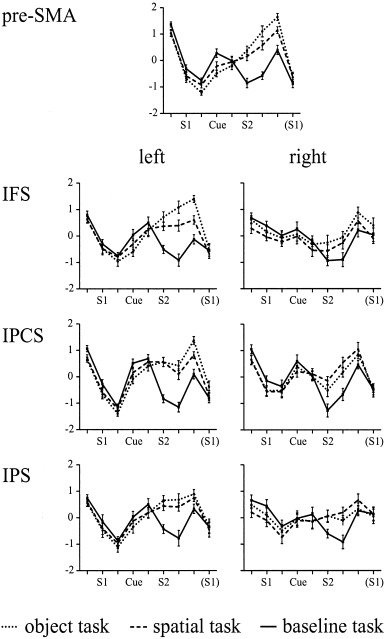
Time course of the activation patterns (mean z‐scores + 1 SEM) for each of the three tasks and the regions of interest analyzed in Experiment 1.
Official websites use .gov
A
.gov website belongs to an official
government organization in the United States.
Secure .gov websites use HTTPS
A lock (
) or https:// means you've safely
connected to the .gov website. Share sensitive
information only on official, secure websites.
Time course of the activation patterns (mean z‐scores + 1 SEM) for each of the three tasks and the regions of interest analyzed in Experiment 1.