
Figure 4.
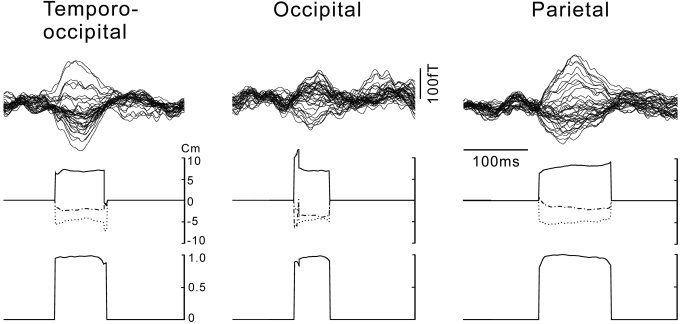
Waveforms of the responses to AM (top), time course of the coordinates of the dipole locations estimated by the single ECD model (middle), and the correlations between the measured and estimated magnetic fields (bottom) for the three subjects in different types, temporo‐occipital, occipital, and parietal type. Waveforms are shown as in Fig. 2. Note that the coordinates are quite stable and the correlation are close to 1 nearly entire durations of the responses. Principal component analysis also revealed that the magnetic fields during the same periods could be explained by the first component up to 99.1, 95.5, and 96.9% for the data of temporo‐occipital, occipital, and parietal type, respectively, that indicate the validity of the single dipole model. X: dash‐dot; Y: dot; Z: solid line. (See Materials and Methods for the explanation of the coordinate system used.)