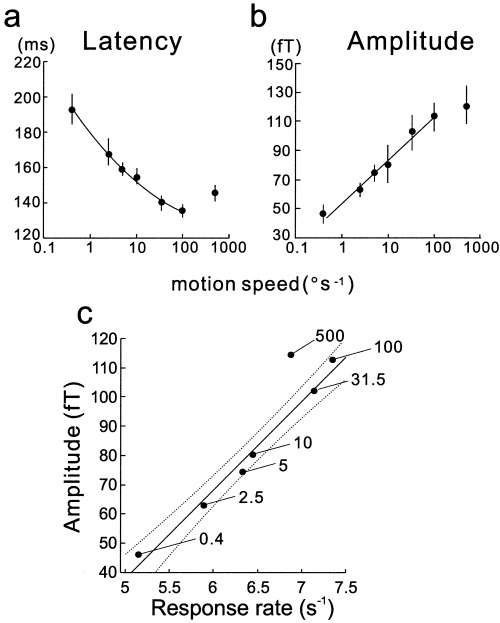
Figure 3.

Changes in the peak latency and the amplitude of the MEG response to varying speeds of motion. The latency is inversely related to the speed of motion up to 100°/sec (a), whereas the amplitude increases with the speed monotonically up to 100°/sec (b). Both data represent the mean (±SEM) values across all data from seven subjects. The relationship between latency and amplitude is not linear because the latency change with the logarithmic value of the speed is not linear although the amplitude change is. In contrast, a clear linear relationship is found between response rate (reciprocal of the latency) and amplitude except for the data for 500°/sec (c). Dashed lines show 95% confidence area.
