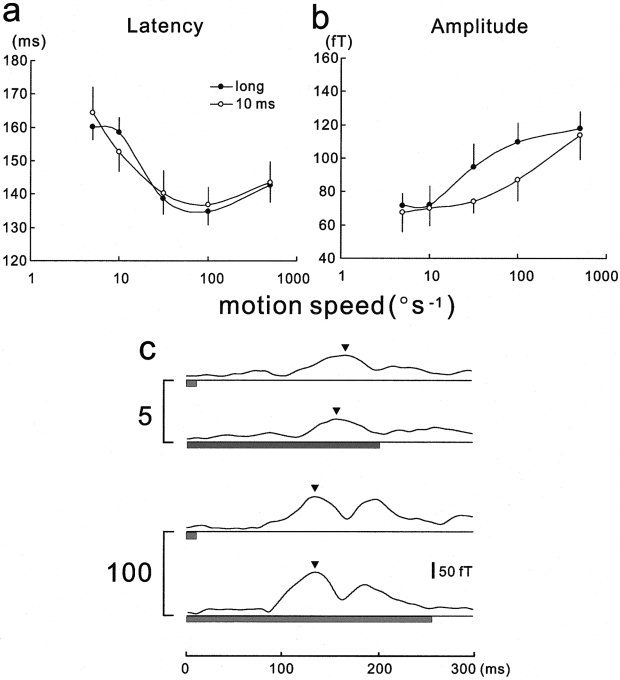
Figure 4.

Effect of duration of the motion stimulus on MEG response latency and amplitude. The mean (±SEM) latencies for a duration of 10 msec did not differ significantly from the values for durations longer than the peak latencies (long) when the speed was between 5 and 500°/sec (P > 0.05, three‐way ANOVA) (a). In contrast, the mean (±SEM) amplitudes for a 10‐msec duration were significantly smaller than those for long durations (P < 0.05, three‐way ANOVA) (b). Illustrative waveforms of the responses to various durations at speed values between 5 and 100°/sec are shown (c). Waveforms are plotted as in Figure 2 and arrowheads indicate the peak of the RMS values.
