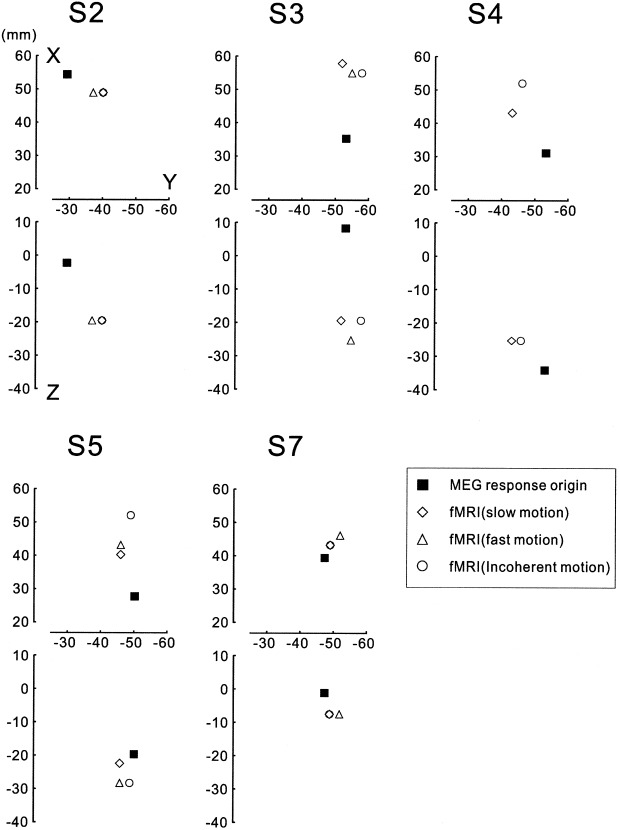
Figure 8.

Estimated magnetic response source (mean dipole location) and peak locations of the BOLD signal increase in the right occipitotemporal region for each subject shown on the coordinate system similar to the Talairach coordinate. Note that the locations are relative and differ among the subjects because the analysis was performed on individual brain and the images were not normalized. The peak locations of the BOLD signal increase were within the same region for each subject because the spatial extent of the region was more than 20 mm in diameter. The dipole locations on the Y (anteroposterior) axis were similar to those for BOLD peaks for all the subjects compared to the differences on the X (mediolateral) and Z (ventrodorsal) axes.
