
Figure 4.
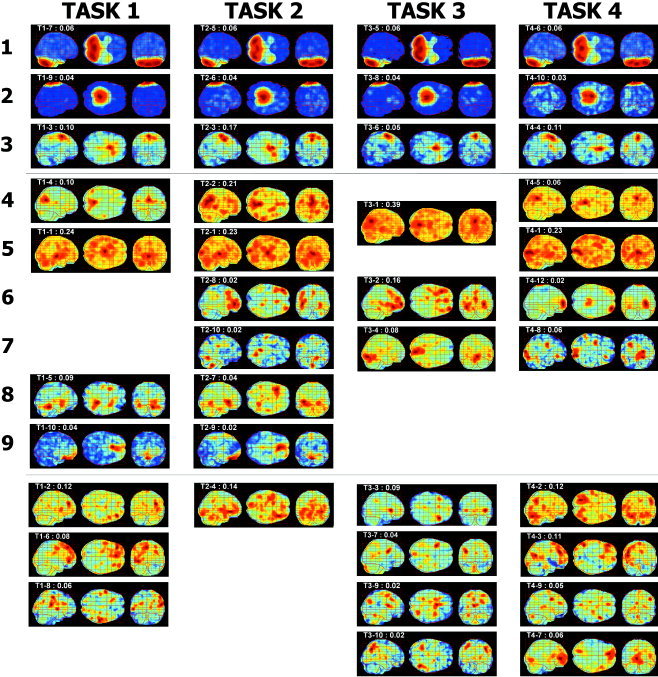
The resultant functional components of PET images during four tasks derived by spatial independent component analysis. The maximum intensity projection maps of functional components corresponding to experimental tasks are displayed. The left map of each figure represents the sagittal section view of maximum intensity and the left side of the map is the posterior brain. The middle map of each figure represents the transverse section view: the top side shows the left brain and the left side shows the posterior brain. The right map of each figure represents the coronal maximum intensity: the left side of the coronal map shows the left side of the brain and the top side shows the top of brain. The relative contribution of the component in composing brain activation of each subject is displayed at the top‐left of each map with the task number and the order in that task. Ten highly contributed components were reordered to similar patterns across the tasks by the correlation coefficient (r) between images of different tasks and visual inspection. Rows 1–3 components show a high correspondence across tasks and rows 4–9 show medium correspondence. The components under the bottom line are unmatched components that we could not match among tasks.