
Figure 5.
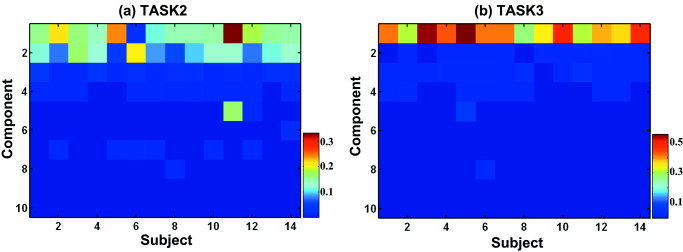
Weight usage of subjects at task 2 and task 3. The weights of functional components according to subjects are displayed during task 2 (a) and task 3 (b) in order to illustrate the homogenous usage of weights with little variation. Components were ordered from high relative contribution to low contribution to the original image. The color scale indicates strengths of weights, i.e., strengths of the usage of each component in the subjects.