
Figure 1.
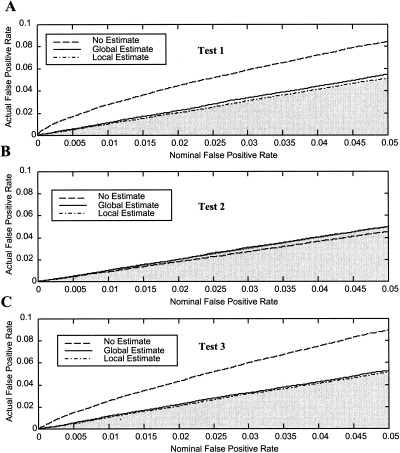
False‐positive rates for three tests and three noise estimates vs. the nominal significance level for synthetic noise data. A: Test 1 (no assumed form). B: Test 2 (assumed peak values). C: Test 3 (assumed hemodynamic shape). In all tests, not estimating the noise parameters produced false‐positive rates significantly different from nominal values, although Test 2 was least sensitive. Values above the shaded region are inappropriately high, while values in the shaded region are too low.