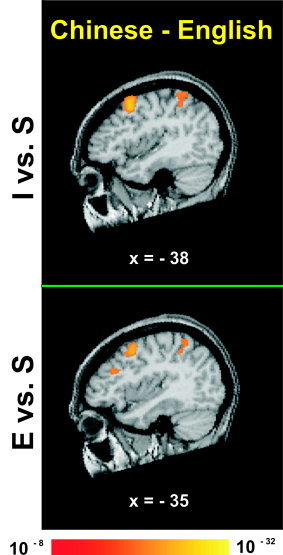
Figure 1.

Averaged fMRI activation maps obtained from direct comparison of intonation (top) and emotion (bottom) judgments relative to a passive listening baseline between the two language groups (Chinese minus English). Both panels show a left sagittal section through stereotaxic space superimposed onto a representative brain anatomy. Stereotaxic coordinates (mm) are derived from the human brain atlas of Talairach and Tournoux [ 1988]. I = discrimination judgments of intonation; E = discrimination judgments of emotion; S = passive listening to Chinese speech. Both panels show activation foci in left‐sided frontal and parietal regions.
