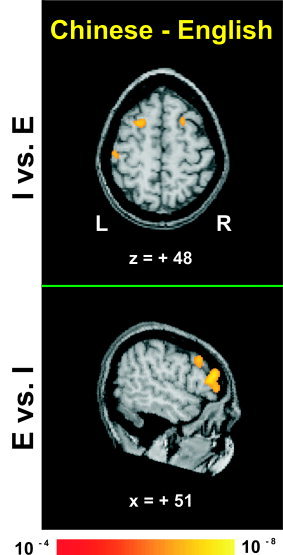
Figure 2.

Averaged fMRI activation maps obtained from direct comparison of intonation (top) and emotion (bottom) judgments relative to each other between the two language groups (Chinese minus English). Top and bottom, respectively, show axial and right sagittal sections through stereotaxic space superimposed onto a representative brain anatomy. Stereotaxic coordinates (mm) are derived from the human brain atlas of Talairach and Tournoux [ 1988]. I = discrimination judgments of intonation; E = discrimination judgments of emotion. Top: Activation foci bilaterally in frontal regions and in the left inferior parietal lobule. Bottom: In contrast, shown is activation in right frontal areas only.
