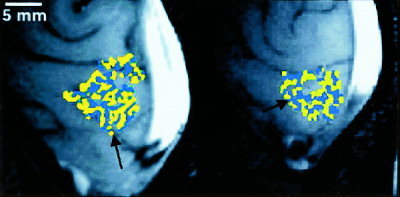
Figure 1.

Maps of ocular dominance for two subjects. Blue (yellow) represents image voxels whose fMRI response was greater in magnitude during right (left) eye stimulation than during left (right) eye stimulation. Images have been cropped. The back of the head is to the right of each image, and the bright white area at the right of each image is the sagittal sinus. About the calcarine sulcus (indicated by black arrows), map voxels of ocular dominance are arranged as stripes, consistent with the known columnar architecture of ocular dominance.
