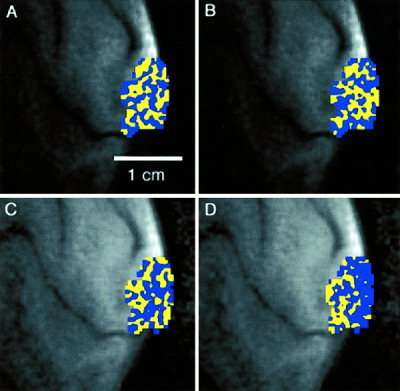
Figure 2.

Maps of ocular dominance for one subject obtained from (A) the first half of a 4‐sec duration stimulus run; (B) the second half of a 4‐sec duration stimulus run; (C) the first half of a 10‐sec duration stimulus run; (D) the second half of a 4‐sec duration stimulus run.
