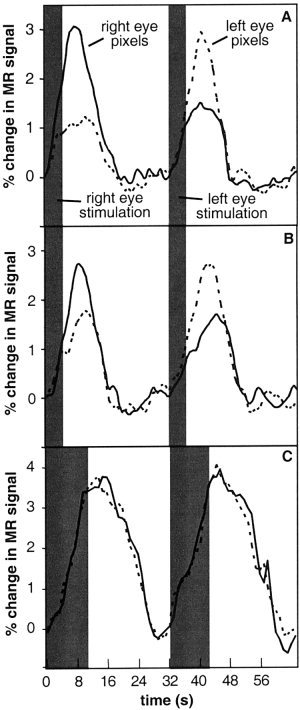
Figure 3.

Average time‐course of MR signal over one trial (expressed as a percentage change from baseline) within ocular dominant image voxels for one subject. Corresponding (fellow) eye stimulation refers to blue (yellow) voxels during right eye stimulation and to yellow (blue) voxels during left eye stimulation. The shaded gray region indicates the duration of the visual stimulus. A: The average time‐course of MR signal over one right‐eye stimulation and one left‐eye stimulation trial for a right eye voxel (i.e., blue) and left eye voxel (i.e., yellow) of an ocular dominance map created for a stimulus duration of 4 sec. B: The average time‐course of MR signal for the same voxels as in (A) for a repeated experiment within the same imaging session. The right‐eye dominance of the right eye voxels of the first experiment remains observed during the repeated experiment. Likewise, the left eye voxels of the first experiment exhibit left‐eye dominance during the repeated experiment. C: The average time‐course of MR signal for the same voxels in (A) for a repeated experiment within the same imaging session with a stimulus duration of 10 sec. The dissociation between right eye and left eye dominance has been lost due to the spatial spread of the hemodynamic response to a long‐duration stimulus.
