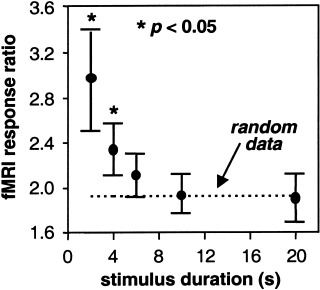
Figure 4.

The ratio of the average magnitude of the fMRI response within a blue (yellow) voxel during right (left) eye stimulation to the average magnitude of the fMRI response within the same voxel during left (right) eye stimulation (termed the “fMRI response ratio”) as a function of stimulus duration. The dashed line indicates the fMRI response ratio for a randomly generated data set selected from a population with a mean and standard deviation similar to the experimental data. The asterisk indicates a fMRI response ratio that is statistically greater than that for the random data. Error bars indicate SE of the mean for all voxels in each functional map.
