
Figure 1.
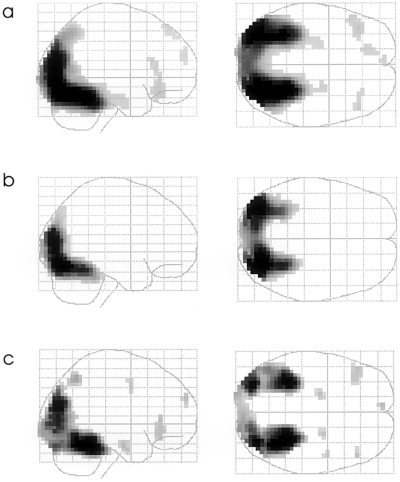
Glassbrain projections of the contrasts (a) novel pictures vs. non‐pictorial stimuli; (b) repeated pictures vs. non‐pictorial stimuli; (c) novel vs. repeated stimuli. The statistical threshold is set to P < 0.05, corrected for multiple comparisons (Z > 4.29). Clusters are depicted if they exceed five suprathreshold voxels.