
Figure 2.
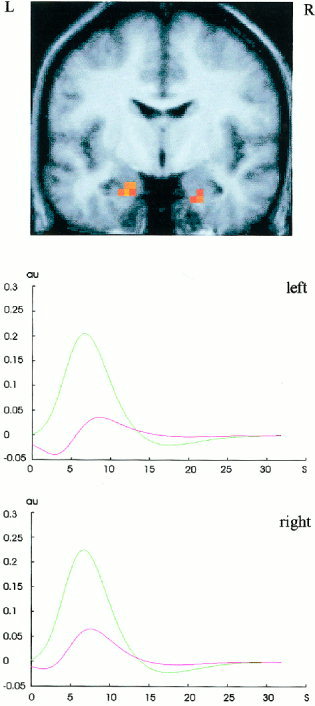
(a) Bilateral hippocampal activation of the contrast novel vs. repeated pictures projected on the normalized mean brain of the participants at P < 0.05, corrected for multiple comparisons (Z > 4.29). The peak differential activation on the left side (Z =5.22; 10 voxels) is located at the MNI coordinates (in brackets are the transformed Talairach coordinates) x = −20 (−20), y = −8 (−9), z = −24 (−20). The peak differential activation on the right side (Z = 5.14; 7 voxels) is located at x = 24 (24), y = −8 (−9), z = −28 (−23). (b) Fitted and adjusted hemodynamic responses to novel and repeated stimuli in bilateral hippocampal peak voxels expressed in adimensional units (au) against time (s).