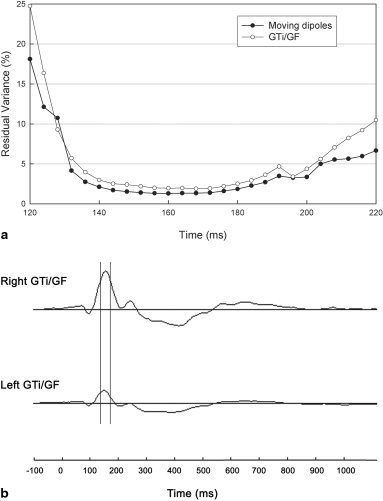
Figure 5.

Results from the fMRI‐constrained source analysis of the grand‐average ERPs in response to the task of “form only.” a: Curve of RV resulted from the fMRI‐seeded dipole modeling in comparison with that from the moving dipole modeling. b: The source waveforms of the pair of fixed dipoles at GTi/GF.
