
Figure 4.
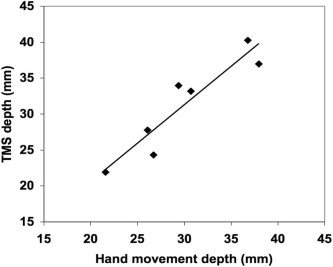
A scatter plot of the depths from the scalp surface for the M1 response to voluntary index finger movement (x‐axis) and TMS‐induced FDI activation (y‐axis) is shown. The depths of the responses were highly correlated (r = 0.93; P < 0.002). This indicates that the depth of the TMS‐induced activation was a function of the actual depth of the M1 cortex, as BA4 is known to extend a varying distance upward from the BA 3 border in the depths of the sulcal pit.