
Figure 5.
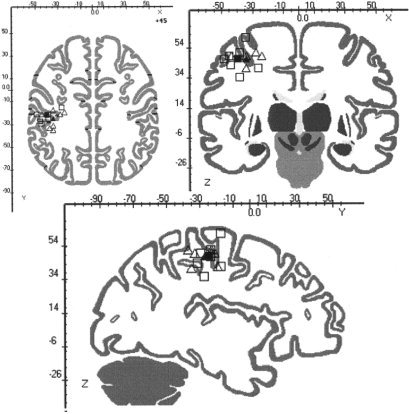
The locations of M1 responses to voluntary finger movement (squares) and to TMS‐induced finger movement (triangles) in standardized coordinates for each of seven subjects are illustrated. Per‐subject locations are open symbols; average locations are solid symbols. Location of activation did not differ significantly in any axis between the two types of M1 activation. Responses are plotted using the BrainMap Search and View software (online at http://www.brainmapdbj.org).