
Figure 6.
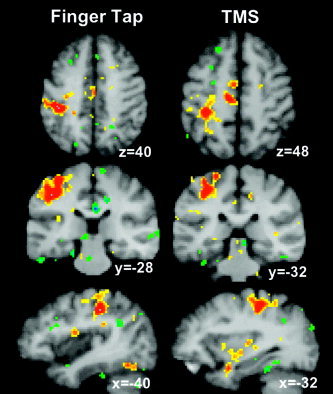
PET Responders. The M1 response to voluntary finger tapping (left group) and the M1 response to TMS (right group) are shown in group‐mean SPIs formed from the seven subjects in whom a significant M1 response to TMS was observed with per‐subject PET image analysis. For both conditions, Z‐score rose with averaging: to 5.7 (from 4.2) for voluntary movement, and to 5.0 (from 4.3) for TMS. The center‐of‐mass of the responses in the two images are very similar (Table III). In both SPIs, the response lies deep in the central sulcus, not on the gyral crown, supporting a column‐based model of E field effects on cortex.