
Figure 2.
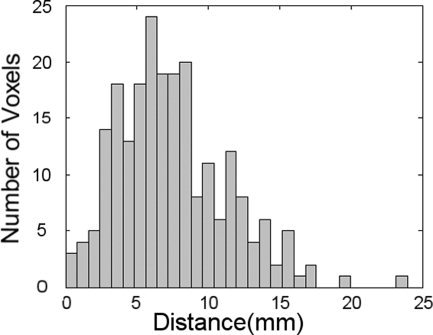
Histogram of the distribution of distances between the centroids of each of eight corresponding regions of simulated brain activation in each of two artificial functional images produced using 28 MRIs. For each MRI the synthetic activations were subject to two transformations to bring them into registration with the MNI template, the first using the participants MRI, and the second using the best matched head shape from the other 27 MRIs to approximate the correct transformation.