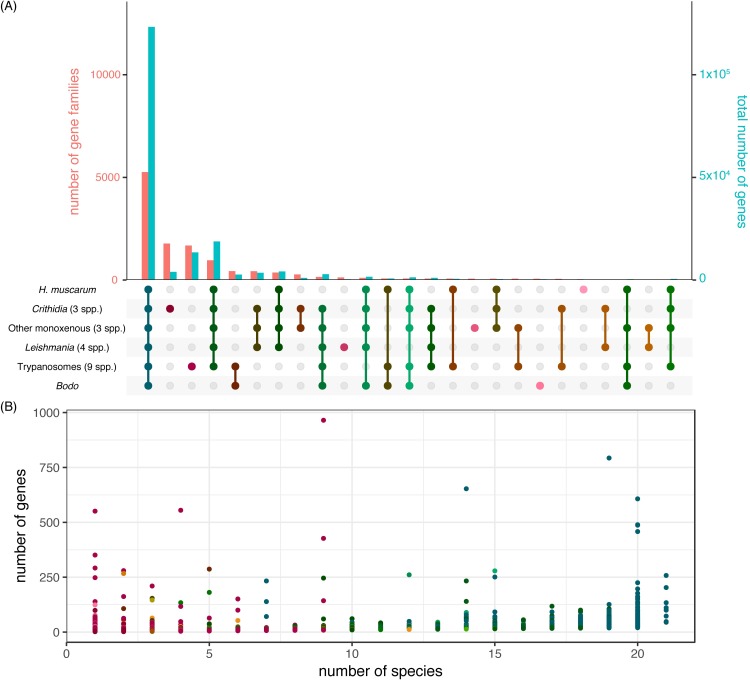
Fig 5. A global view of gene family sharing between trypanosomatids.
A. The numbers of gene families (orthogroups; pink bars; values on left-hand y-axis) and the numbers of genes in those groups (blue bars; values on right-hand y-axis) with particular patterns of sharing between high-level groups in our Orthofinder data. Shading in the lower panel from pink to blue represents how widespread each set of families are, with pink representing families specific to one group and dark blue those families present in all groups. B. Scatterplot of gene family size against the number of species a family is present in, with each point representing a single gene family (families with less than 3 genes in total are excluded), and points coloured according to the number of higher-level taxonomic groups they are shared between, as in the lower part of panel A. [code to draw this diagram is a modified version of UpSetR].

