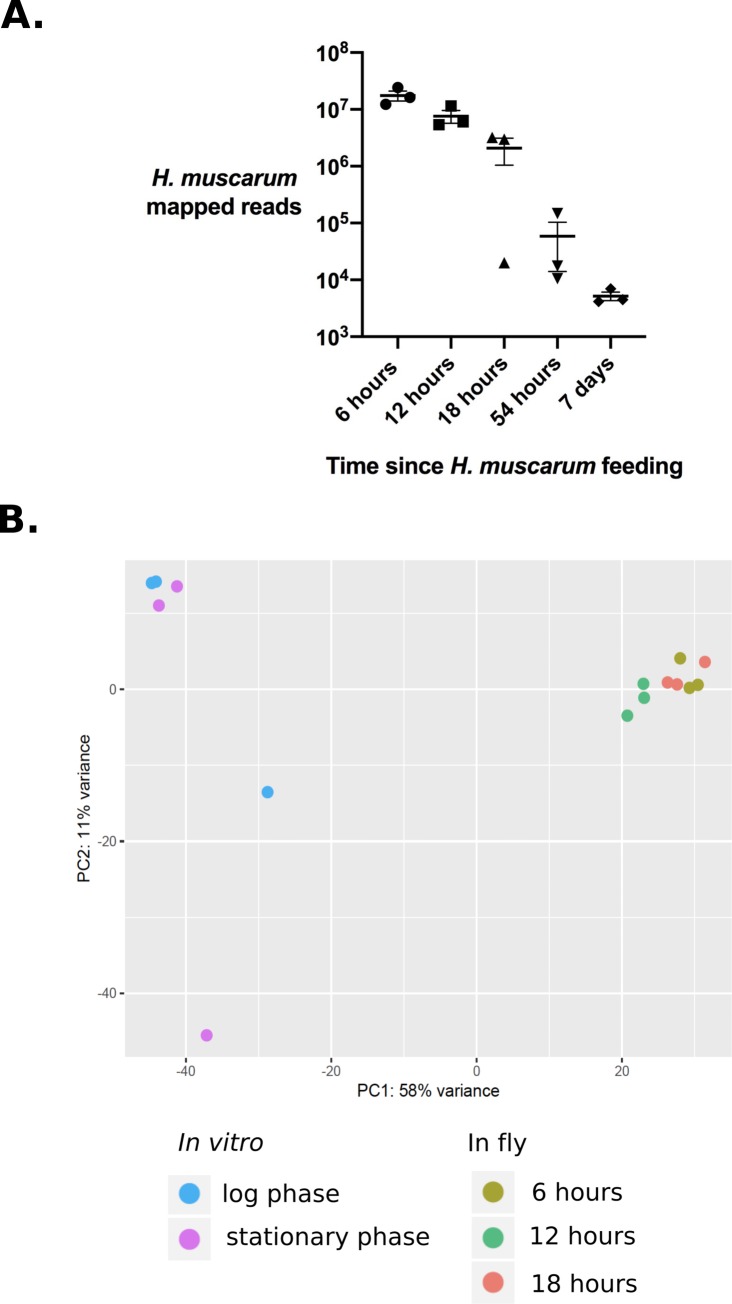
Fig 6.
A. RNA-seq reads extracted from infected flies (whole) which mapped to H. muscarum genome. Error bars show the standard error of the mean. B. Principal component analysis of differentially expressed H. muscarum genes in log phase culture vs. samples isolated from infection flies at 6, 12 and 18 hours post-ingestion. There are two clear sample groupings (circled) which correspond to RNA from l in in vitro culture log phase cells and RNA isolated from infected flies. Different shades of blue indicate the sample origin (n = 3 per condition).

