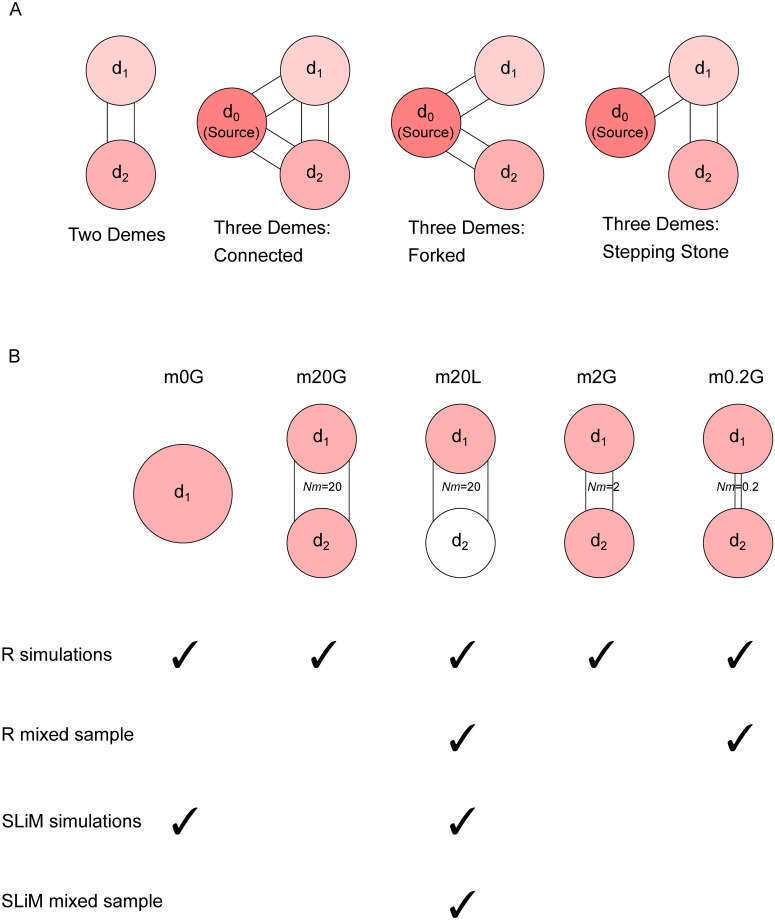
Fig 1. Schematic of evolutionary scenarios in this study.
A: Possible demographies for single-site simulation; two-deme and three possibilities for three-deme. Different shades indicate that selection strength can be different between demes. Migration rates are identical between deme pairs and range from 0.02 to 200. B: Five scenarios explored in the full-locus simulation. Light red indicating selection in that deme and white indicates neutrality. Only m20L and m0.2G were analyzed for mixed-deme samples from R simulations (second row). Only m0G and m20L were simulated with SLiM (third row), of which only the latter were analyzed for mixed-deme samples from SLiM simulations (fourth row). Other scenarios listed in Table 2 were used for FST analysis only.

