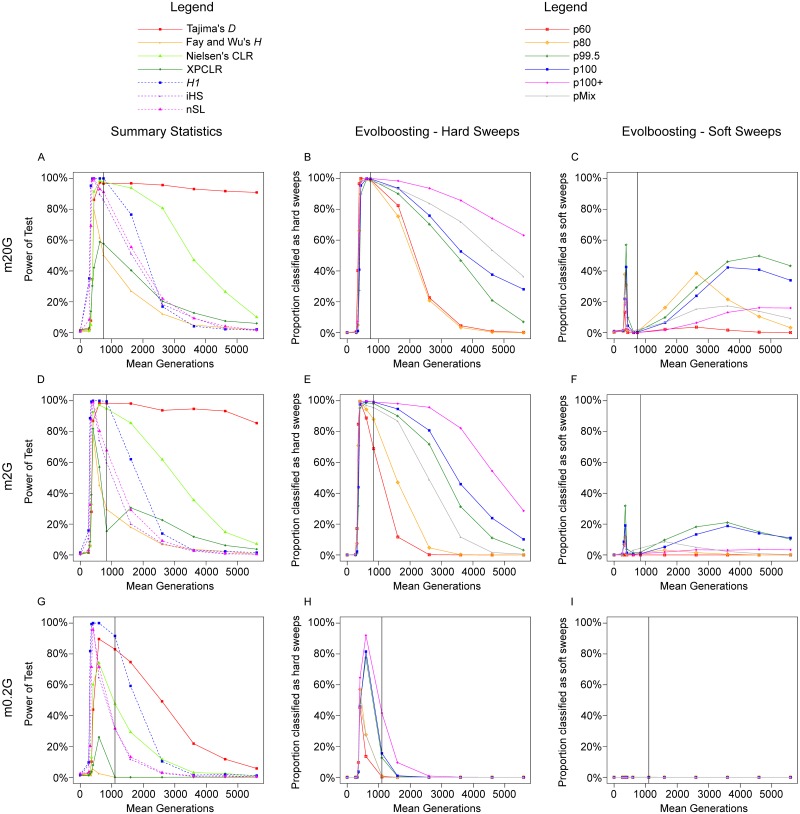
Fig 6. Full-locus simulation: The detection rate of various methods in global adaptation scenarios in the native deme.
The proportion of samples detected as selective sweeps by various methods, under the scenarios: A-C. m20G, D-F. m2G, G-I. m0.2G, in d1 where the adaptive allele arises. The vertical line indicates time of 100% fixation. A,D,G. Power of seven summary statistics; dashed lines indicate haplotype-based methods. B,E,H. Proportion detected by six EvolBoosting predictors correctly as hard sweeps. C,F,I. Proportion detected by six EvolBoosting predictors incorrectly as soft sweeps. See S3 Fig for a zoomed-in version for early stages of m0.2G.

