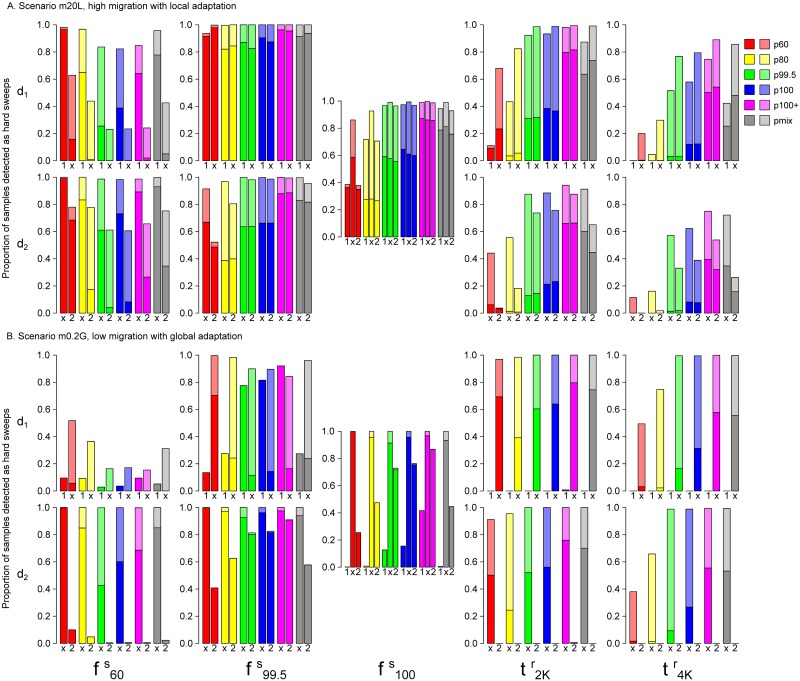
Fig 9. Full-locus simulation: Comparing evolBoosting detection rate of sweeps between deme-specific samples and mixed samples.
The proportion of samples detected as hard (darker shade) or soft sweeps (lighter shade) by six EvolBoosting predictors, from d1, mixed samples and d2 (noted below the bars as “1”, “x” and “2”). Scenarios are A: m20L, B: m0.2G. (global fixation) is shared by both demes, thus the graph in the middle contains results from d1, mixed and d2. The other four time points are deme-specific, thus we must compare only one deme with mixed data.

