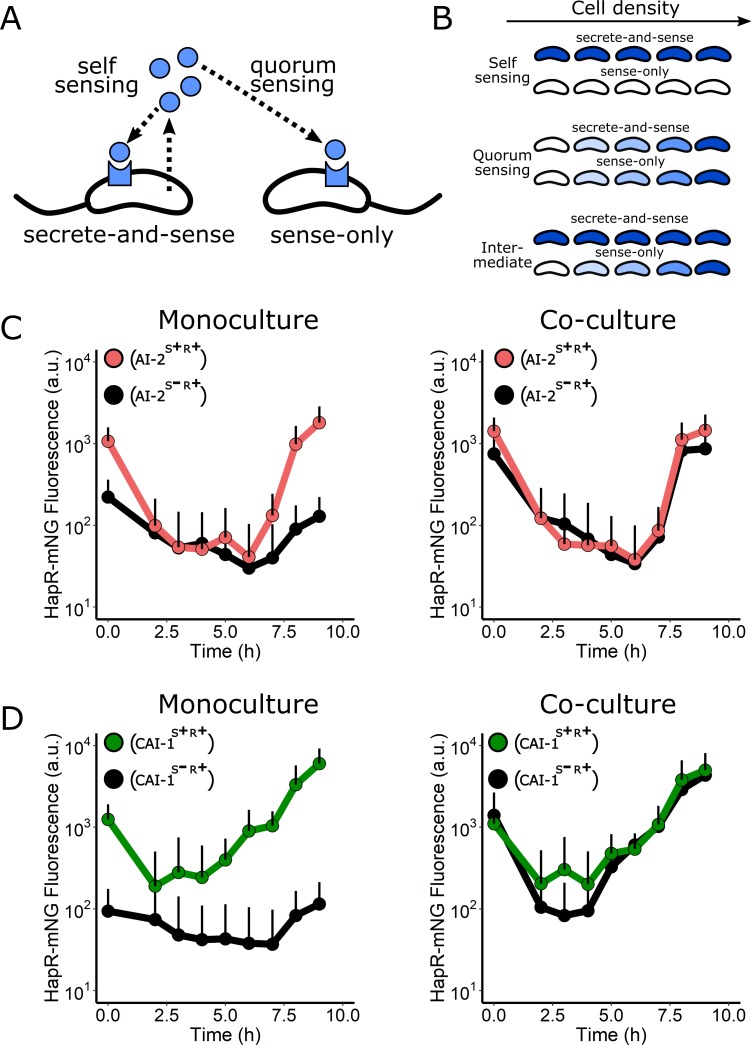
Fig 7. The CqsS/CAI-1 circuit is primarily a QS circuit, not a self-sensing circuit.
(A) Schematic showing self-sensing and QS. See text for details. (B) Predicted HCD gene expression level (shades of blue) over increasing cell density for cocultured secrete-and-sense and sense-only strains if a circuit exhibits exclusive self-sensing behavior (top), QS behavior (middle), or an intermediate state in which both self-sensing and QS occur (bottom). (C) Left panel: average individual cell HapR-mNG fluorescence for the V. cholerae AI-2 S+R+ (red) and the AI-2 S−R+ (black) strains grown in monoculture. Right panel: the same strains grown in coculture. (D) Left panel: average individual cell HapR-mNG fluorescence for the V. cholerae CAI-1 S+R+ (green) and the CAI-1 S−R+ (black) strains grown in monoculture. Right panel: the same strains grown in coculture. Error bars represent SD of individual cell measurements at each time point. Numerical data are available in S1 Data. AI-2, autoinducer-2; a.u., arbitrary unit; CAI-1, cholerae autoinducer-1; mNG, mNeonGreen; QS, quorum sensing.

