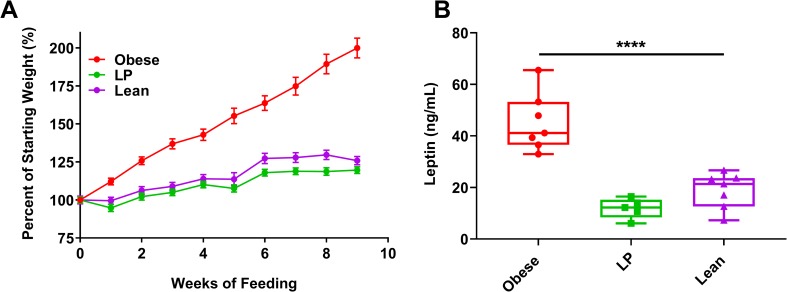
Fig 1. Weights of mice following feeding on different diets.
Groups of C57BL/6N mice (7 mice per group) were fed a 45% fat (Obese), 5% protein (LP), or a control (Lean) diet for 8–10 weeks. A. Weights were measured weekly or bi-weekly following the initiation of feeding. Weights are plotted as the percent change compared to initial weight at the onset of feeding. B. Leptin was measured following 8–10 weeks of feeding using an ELISA. Statistical comparisons were made using a one-way ANOVA with Dunnett’s correction compared to the control group. The level of significance is represented as follows—**** p<0.0001. For A, the error bars represent standard error. For B, the whiskers represent the minimum and maximum points, the box limits represent the 25th and 75th percentile, and the horizontal line represents the median. Each graph represents data obtained from at least two independent experiments. The results from one representative experiment are presented.

