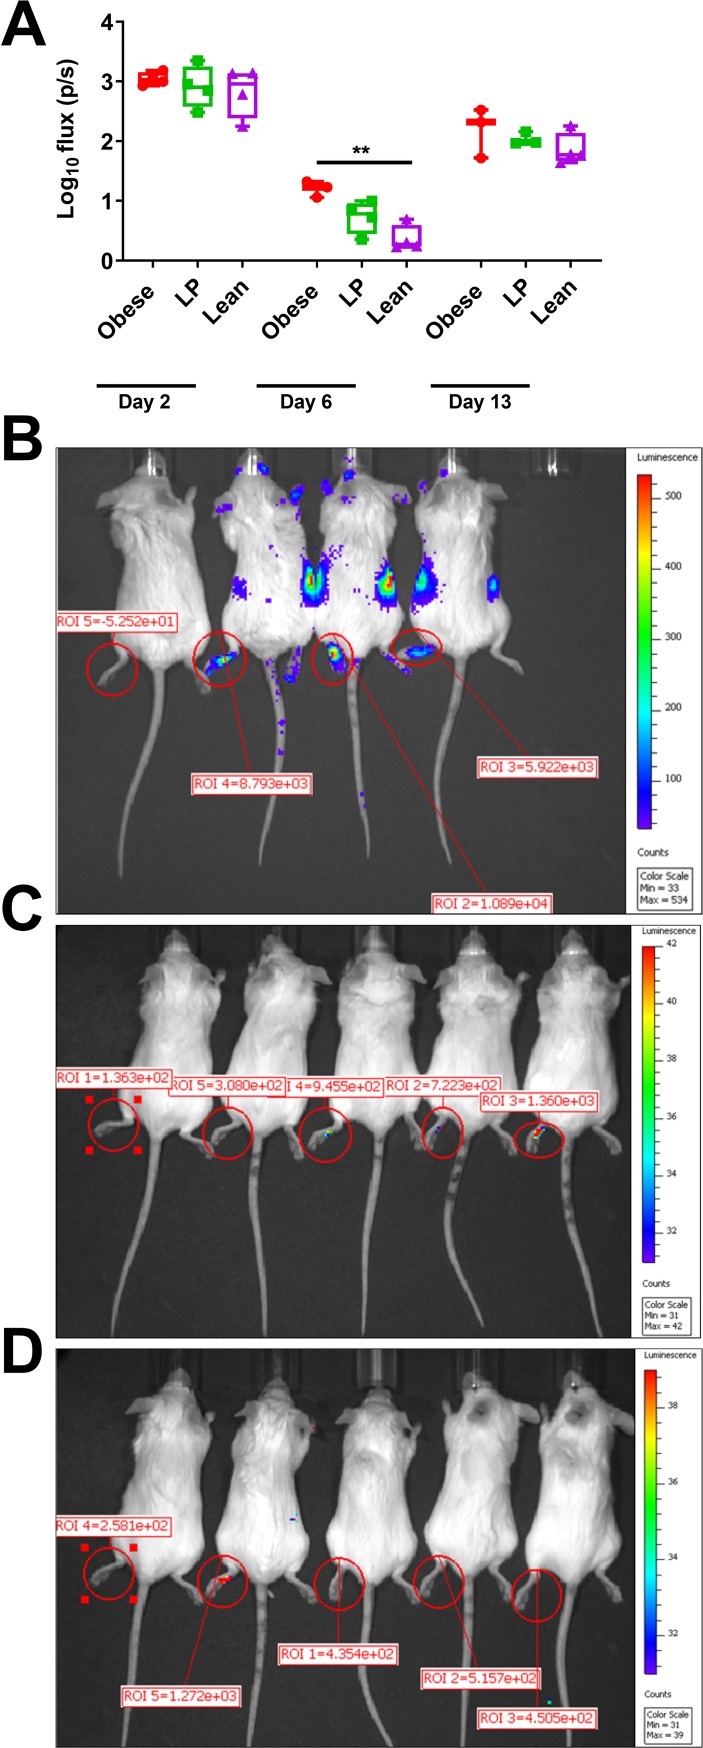
Fig 4. Local viral replication is increased in obese mice.
Groups of albino C57BL/6N mice (5 mice per group) were fed either a 45% fat (Obese, B), 5% protein (LP, C) or control diet (Lean, D) for 8–10 weeks. Mice were then infected with Mayaro virus (MAYV) expressing nano-luciferase (nLuc) to track replication. At different time points post-infection, mice were anesthetized, injected intraperitoneally with 20 μg/mouse of the furimazine substrate and imaged using a Perkins Elmer IVIS Spectrum machine. Mice were imaged for 15 seconds within 5 minutes of substrate administration, and photon flux (photons/second) was quantified in the hind left footpad using Living Image software (A). The whiskers represent the minimum and maximum points, the box limits represent the 25th and 75th percentile, and the horizontal line represents the median. The data are presented as flux or photons/second (p/s) present within the left footpad. The flux is used to quantify the amount of light emitted from the footpad. Representative images of mice fed different diets, infected with MAYV-nLuc, and then imaged six days following infection (B-D). An uninfected control mouse is presented as the leftmost mouse in each image. Statistical analyses were performed by two-way ANOVA with Dunnett’s correction compared to the control group. The level of significance is represented as follows—** p<0.01.

