
Figure 2.
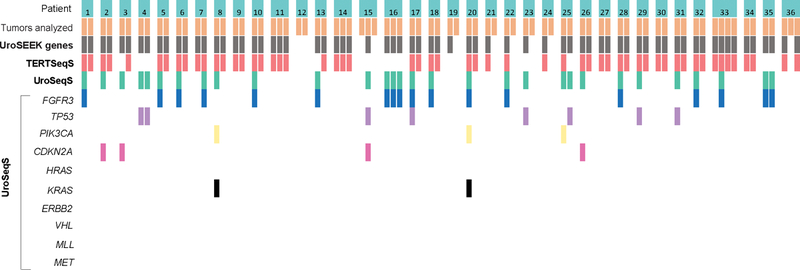
Oncoplot representation of mutations in UroSEEK gene panel and its TERTSeqS and UroSeqS components in 36 patients with sequential tumors. Each broad column represents one patient. The individual tumor per patient (orange box) and their mutated gene(s) are indicated in each row.